> ## Documentation Index
> Fetch the complete documentation index at: https://docs.contraforce.com/llms.txt
> Use this file to discover all available pages before exploring further.
# Command Dashboard
> Your central hub for monitoring incidents, managing workspaces, and overseeing security operations across all your Microsoft tenants.
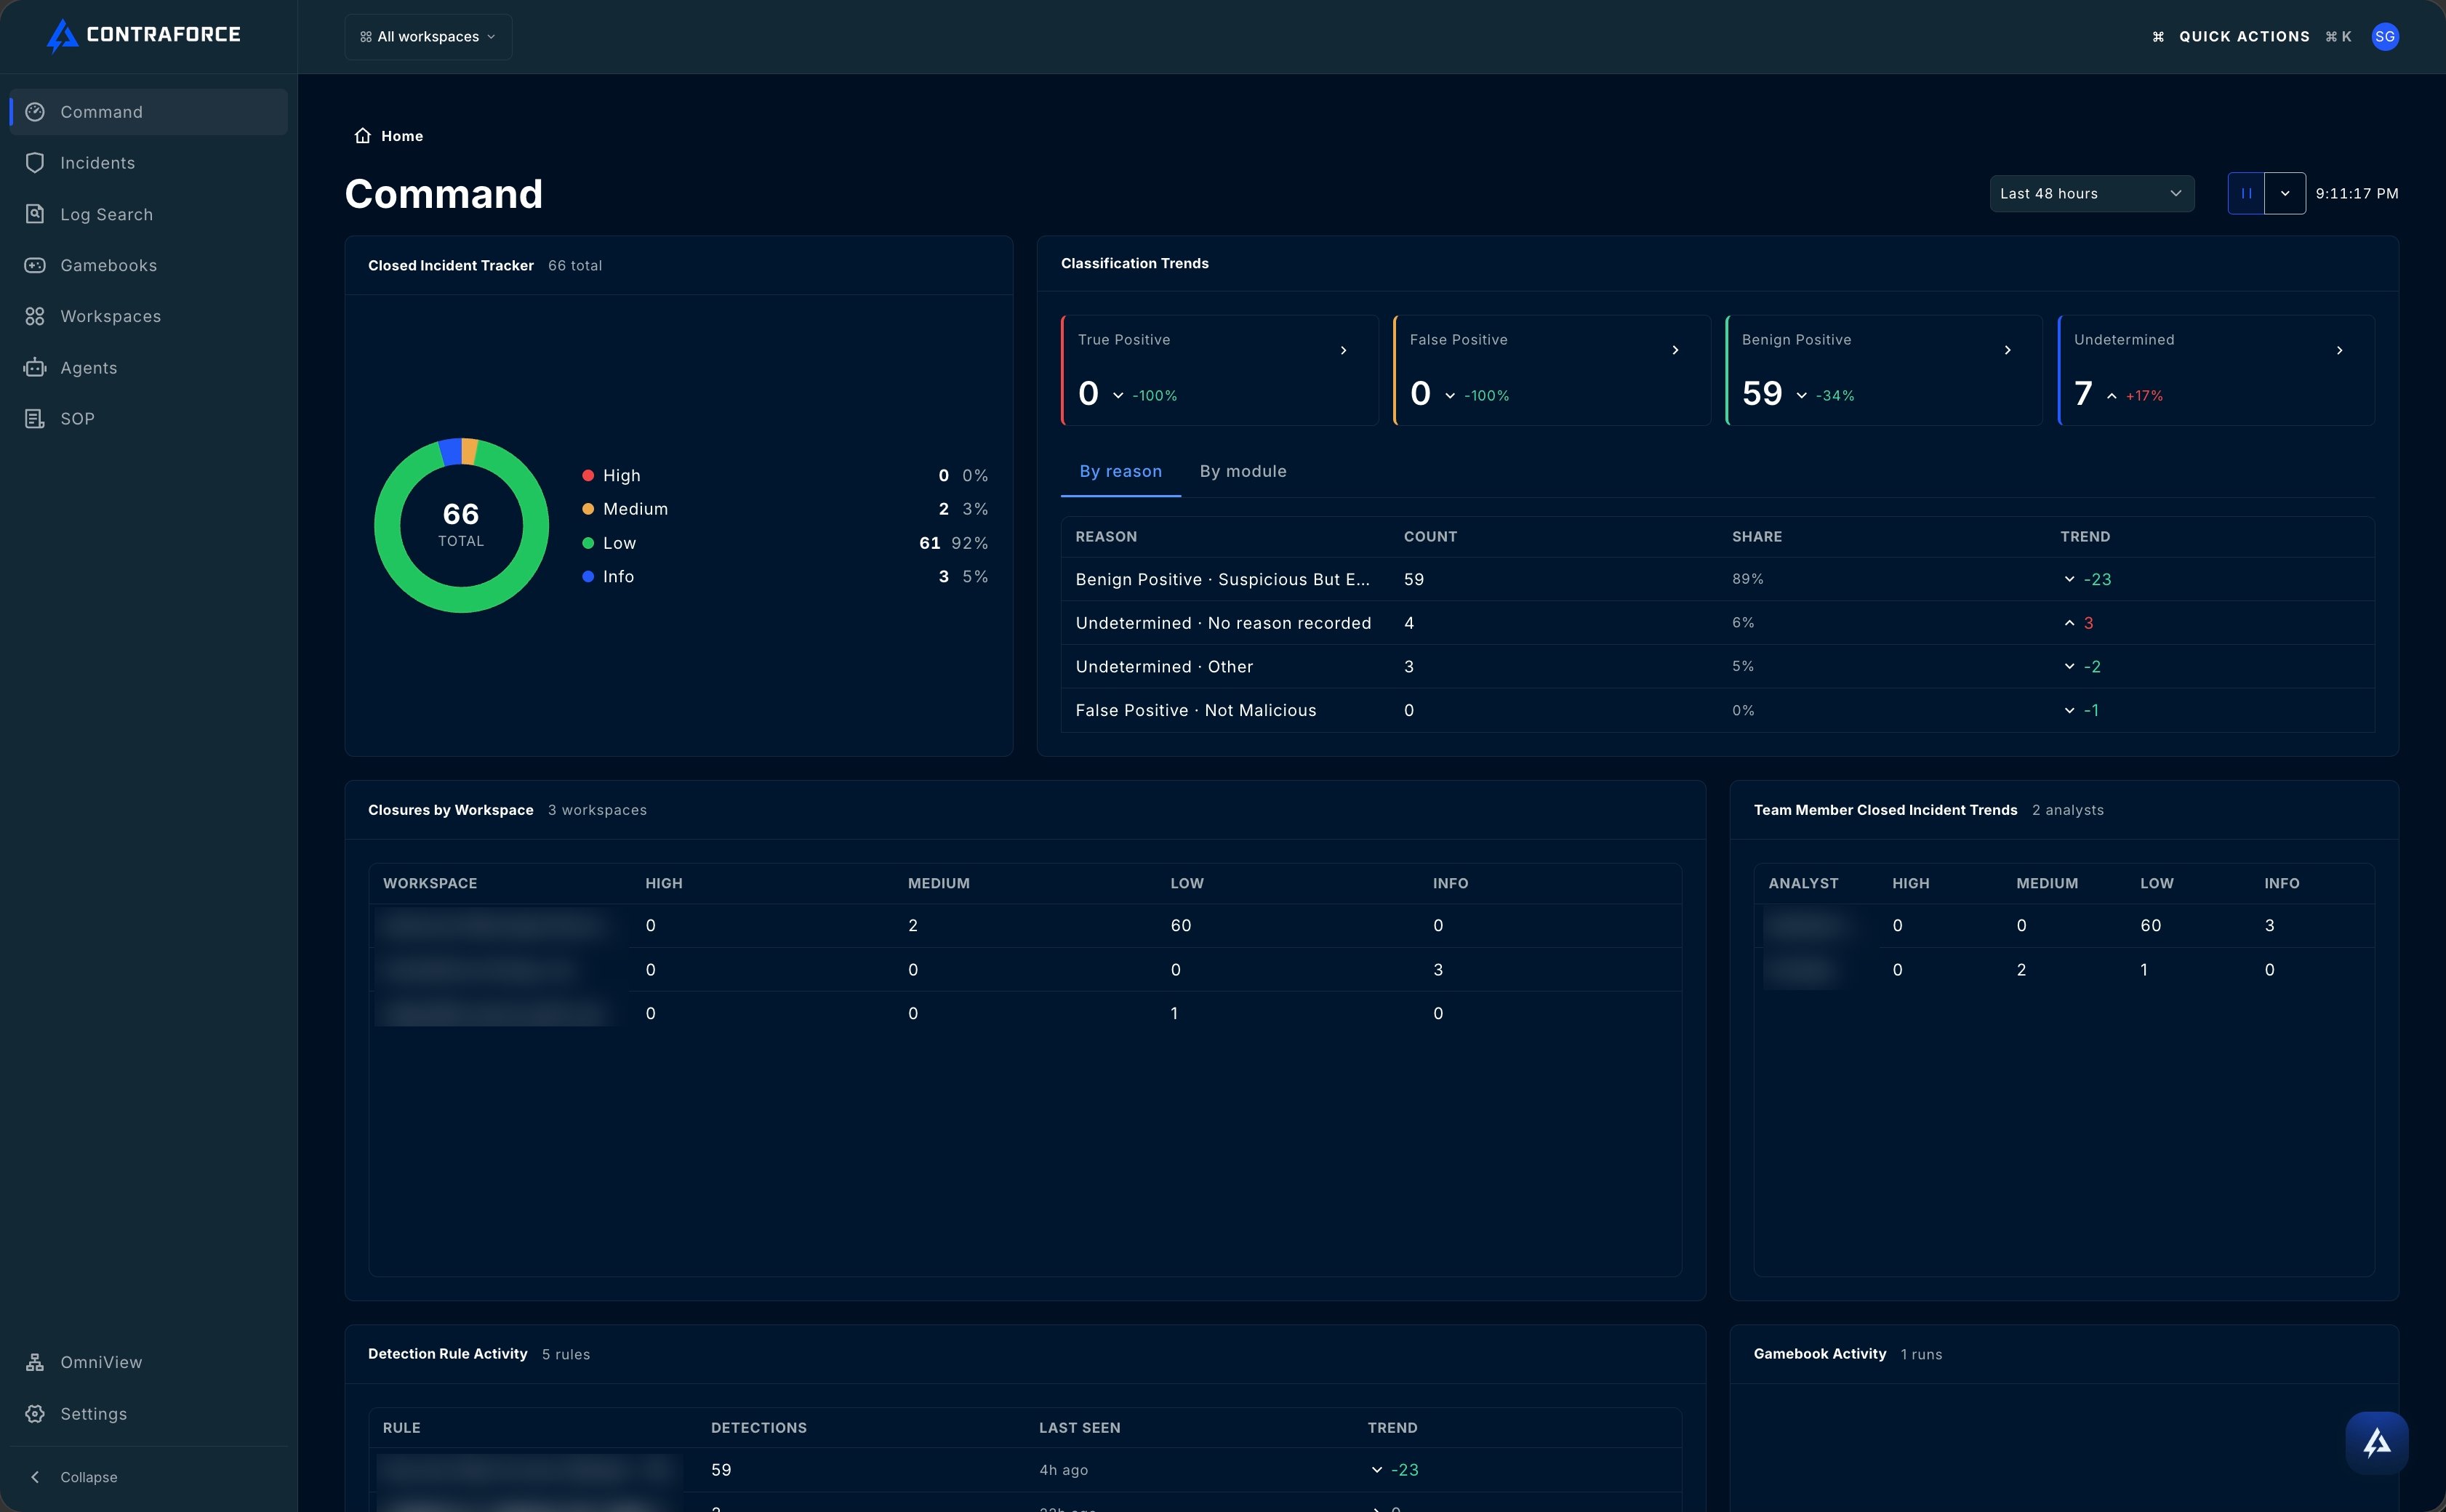
The Command Dashboard is ContraForce's mission control center—a unified dashboard that gives you complete visibility into security incidents, gamebooks queued, and human and agent actions that are audited—across all your managed tenants.
 ## Overview
The Command Dashboard serves as your central hub for overseeing multiple Microsoft tenants through a single, intuitive dashboard. By default, it displays data for all onboarded tenants, with the option to customize your view by filtering specific workspaces.
The Command Dashboard is designed for MSPs, MSSPs, and security teams managing tenants and environments. All data updates in real-time as incidents are detected and resolved.
## Dashboard Cards
The Command Dashboard features four key data cards that provide at-a-glance insights into your security posture:
Displays the number of incidents based on severity and total incidents closed across workspaces. Filter workspaces to see incidents per workspace.
Shows closed incident trends based on classification as well as incident rule trends based on last detections triggered over time.
See how your humans and agents are performing in one place. Track incidents managed by users based on incident severity level.
View all queued gamebooks that are processing or awaiting for approval. Click any incident to review and approve gamebook runs.
## Incidents Table
The Incidents table is the heart of the Command Dashboard, displaying all security incidents across your connected workspaces.
### Table Columns
| Column | Description |
| ------------------ | ---------------------------------------------------------- |
| **Severity** | Incident severity level (High, Medium, Low, Informational) |
| **Workspace** | The tenant/workspace where the incident occurred |
| **Incident Title** | Brief description of the incident |
| **Incident ID** | Unique identifier (click to view details) |
| **Creation Time** | When the incident was first detected |
| **Status** | Current state (New, Active, Closed) |
| **Owner** | Analyst assigned to the incident |
### Filtering Options
You can filter the incidents table by:
* **Workspace** — Select specific workspaces to focus on
* **Severity** — Filter by High, Medium, Low, or Informational
* **Status** — Show only New, Active, or Closed incidents
### Incident Handling at Scale
Rather than updating incidents manually in batches, **Security Delivery Agents** running **on queue** automatically triage and act on incidents as they arrive. See [Configuring Security Delivery Agents](/guides/getting-started/configuring-security-delivery-agents).
## Workspace Filtering
The workspace filter at the top of the Command Dashboard allows you to customize your view:
1. Click the **Workspace Filter** dropdown
2. Select one or more workspaces to display
3. Your selection persists as you navigate to other pages in ContraForce
Your workspace filter selection is maintained across all ContraForce pages during your session. This allows you to focus on specific customers without re-selecting filters on each page.
## Accessing Incident Details
To view detailed information about any incident:
1. Locate the incident in the Incidents table
2. Click the **Incident ID** (hyperlinked)
3. The Incident Details page opens with full investigation capabilities
From the Incident Details page, you can:
* View the complete incident timeline
* See all affected entities
* Run Gamebook response actions
* Add comments and update status
## Next Steps
A complete workflow for triaging, investigating, and resolving incidents.
Manage workspace settings from one central location.
Learn how to properly classify incidents to improve detection accuracy.
Explore all multi-tenant management capabilities.
***
Need help? Contact the ContraForce Support team at [support@contraforce.com](mailto:support@contraforce.com).
## Overview
The Command Dashboard serves as your central hub for overseeing multiple Microsoft tenants through a single, intuitive dashboard. By default, it displays data for all onboarded tenants, with the option to customize your view by filtering specific workspaces.
The Command Dashboard is designed for MSPs, MSSPs, and security teams managing tenants and environments. All data updates in real-time as incidents are detected and resolved.
## Dashboard Cards
The Command Dashboard features four key data cards that provide at-a-glance insights into your security posture:
Displays the number of incidents based on severity and total incidents closed across workspaces. Filter workspaces to see incidents per workspace.
Shows closed incident trends based on classification as well as incident rule trends based on last detections triggered over time.
See how your humans and agents are performing in one place. Track incidents managed by users based on incident severity level.
View all queued gamebooks that are processing or awaiting for approval. Click any incident to review and approve gamebook runs.
## Incidents Table
The Incidents table is the heart of the Command Dashboard, displaying all security incidents across your connected workspaces.
### Table Columns
| Column | Description |
| ------------------ | ---------------------------------------------------------- |
| **Severity** | Incident severity level (High, Medium, Low, Informational) |
| **Workspace** | The tenant/workspace where the incident occurred |
| **Incident Title** | Brief description of the incident |
| **Incident ID** | Unique identifier (click to view details) |
| **Creation Time** | When the incident was first detected |
| **Status** | Current state (New, Active, Closed) |
| **Owner** | Analyst assigned to the incident |
### Filtering Options
You can filter the incidents table by:
* **Workspace** — Select specific workspaces to focus on
* **Severity** — Filter by High, Medium, Low, or Informational
* **Status** — Show only New, Active, or Closed incidents
### Incident Handling at Scale
Rather than updating incidents manually in batches, **Security Delivery Agents** running **on queue** automatically triage and act on incidents as they arrive. See [Configuring Security Delivery Agents](/guides/getting-started/configuring-security-delivery-agents).
## Workspace Filtering
The workspace filter at the top of the Command Dashboard allows you to customize your view:
1. Click the **Workspace Filter** dropdown
2. Select one or more workspaces to display
3. Your selection persists as you navigate to other pages in ContraForce
Your workspace filter selection is maintained across all ContraForce pages during your session. This allows you to focus on specific customers without re-selecting filters on each page.
## Accessing Incident Details
To view detailed information about any incident:
1. Locate the incident in the Incidents table
2. Click the **Incident ID** (hyperlinked)
3. The Incident Details page opens with full investigation capabilities
From the Incident Details page, you can:
* View the complete incident timeline
* See all affected entities
* Run Gamebook response actions
* Add comments and update status
## Next Steps
A complete workflow for triaging, investigating, and resolving incidents.
Manage workspace settings from one central location.
Learn how to properly classify incidents to improve detection accuracy.
Explore all multi-tenant management capabilities.
***
Need help? Contact the ContraForce Support team at [support@contraforce.com](mailto:support@contraforce.com).