

What Can You Do Here?
Audit Agent Activity
Review every execution an agent has performed, with timestamps and outcomes.
Troubleshoot Failures
Identify failed executions and investigate causes using status and token data.
Monitor Token Usage
Track AI token consumption per execution to understand cost and complexity.
Prerequisites
Accessing Execution History
1
Navigate to Agent Center
From the left navigation menu, select Agent Center.
2
Select Your Agent
Click the name of the agent you want to review. This opens the Agent Details page.
3
Open the Execution History Tab
On the Agent Details page, click the Execution History tab (next to the Configuration tab).
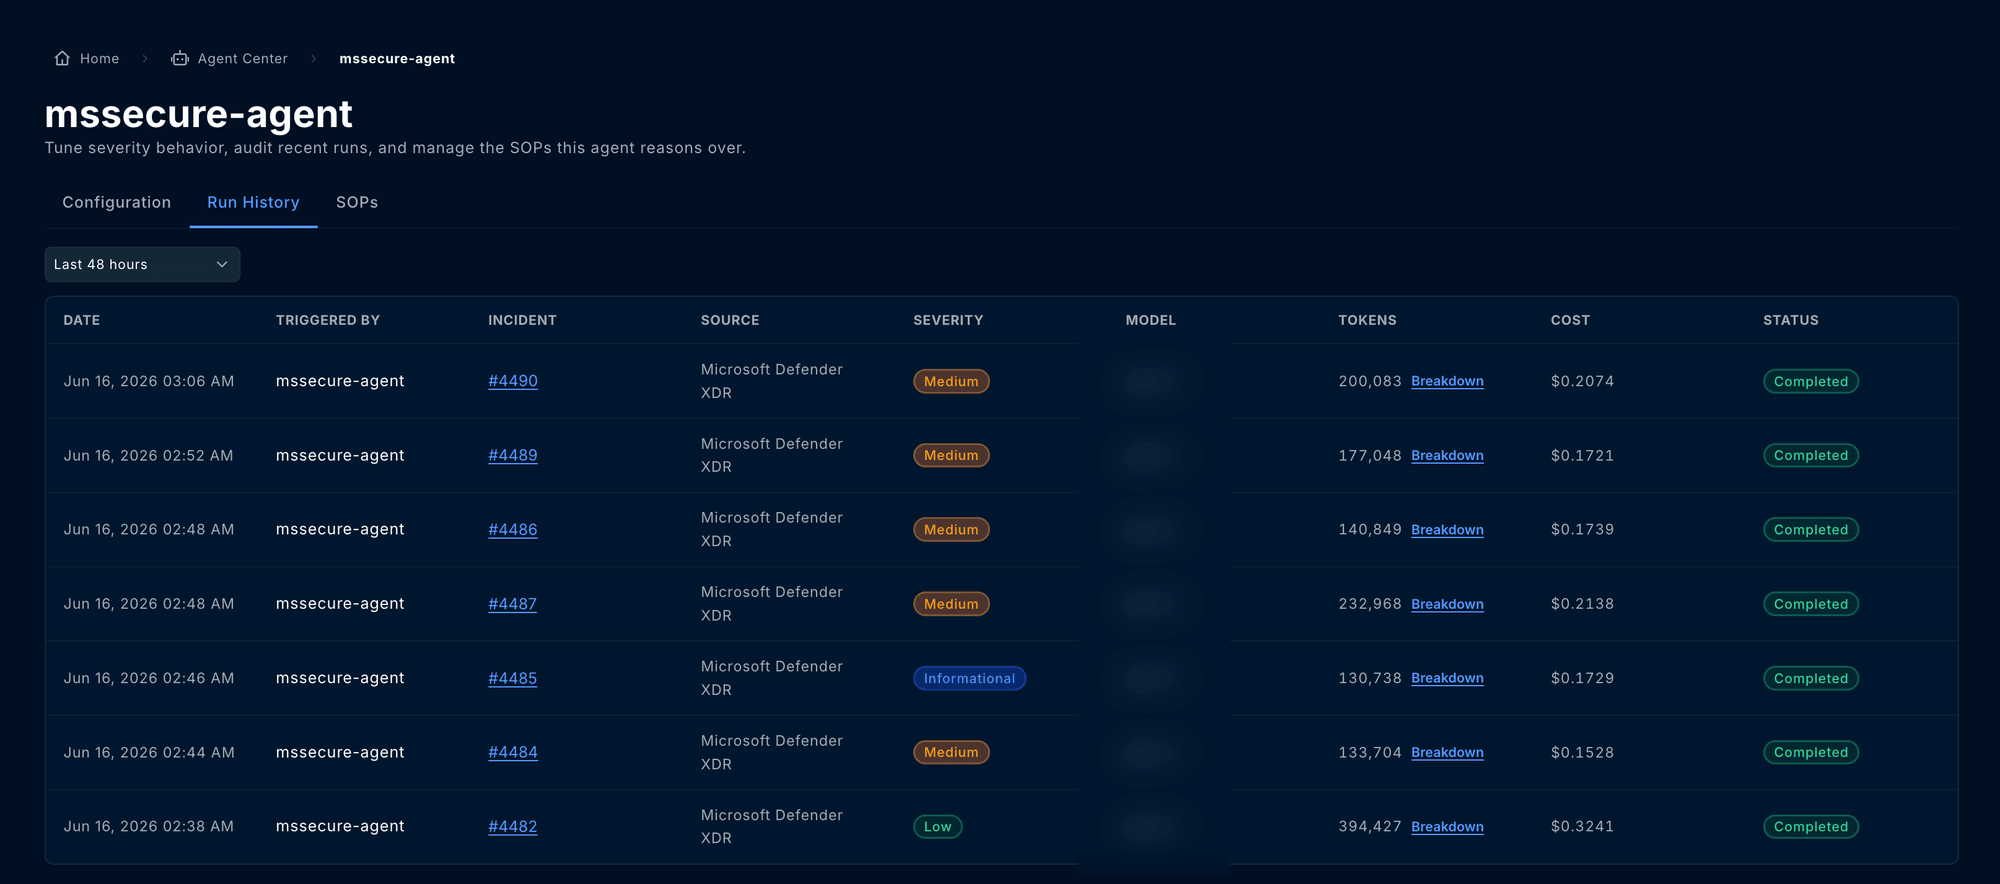
Understanding the Execution History Table
The Execution History table contains the following columns:Execution Statuses
Using Execution History
Investigate a Processed Incident
Click any Incident link (e.g.,#149631) in the table to navigate directly to that incident’s detail page. From there, you can review the full incident timeline, entity context graph, and any Gamebook actions that were executed.
Identify Failed Executions
Filter or scan for rows with a Failed status. Failed executions typically show— in the Tokens column, indicating the agent did not complete its analysis. Common causes include:
If failures persist, contact support@contraforce.com with the agent name, affected incident numbers, and the timestamps of the failed executions.
Monitor Token Consumption
The Tokens column shows how many AI tokens were consumed per execution. This helps you understand the complexity of agent processing and monitor usage. Executions that involve larger incidents with more entities and evidence will typically consume more tokens. To see token usage across your workspaces for the billing cycle and set a monthly token budget, use the Cost Management Center.Best Practices
Review execution history regularly
Review execution history regularly
Check the Execution History tab periodically to confirm agents are processing incidents as expected. Look for patterns in failures, unexpected token spikes, or gaps in execution activity.
Investigate repeated failures on the same incident
Investigate repeated failures on the same incident
If the same incident appears multiple times with a Failed status, the issue is likely environmental (permissions, connectivity) rather than incident-specific. Check the troubleshooting table above.
Use execution data for compliance reporting
Use execution data for compliance reporting
The Execution History table serves as an audit trail for automated response activity. Use it to demonstrate that incidents were triaged and processed within your SLA requirements.
Correlate with Gamebook activity
Correlate with Gamebook activity
Cross-reference Execution History entries with the Gamebook Activity widget on the Command Dashboard to verify that agent-initiated Gamebooks completed successfully.
Troubleshooting
Related Guides
Configuring Security Delivery Agents
Set up and configure agents using the three-phase adoption model.
Deploying Agent Center
Deploy the Microsoft Foundry infrastructure required for agents.
Incident Management
Learn how incidents flow through ContraForce.
Command Dashboard
Monitor agent activity and incident trends from mission control.
Operating Procedures
Upload classification and response procedures and link them to your agents.
Agent Shifts
Set the weekly hours when an agent investigates incidents on its own.
Questions about Agent Execution History? Contact us at support@contraforce.com.