

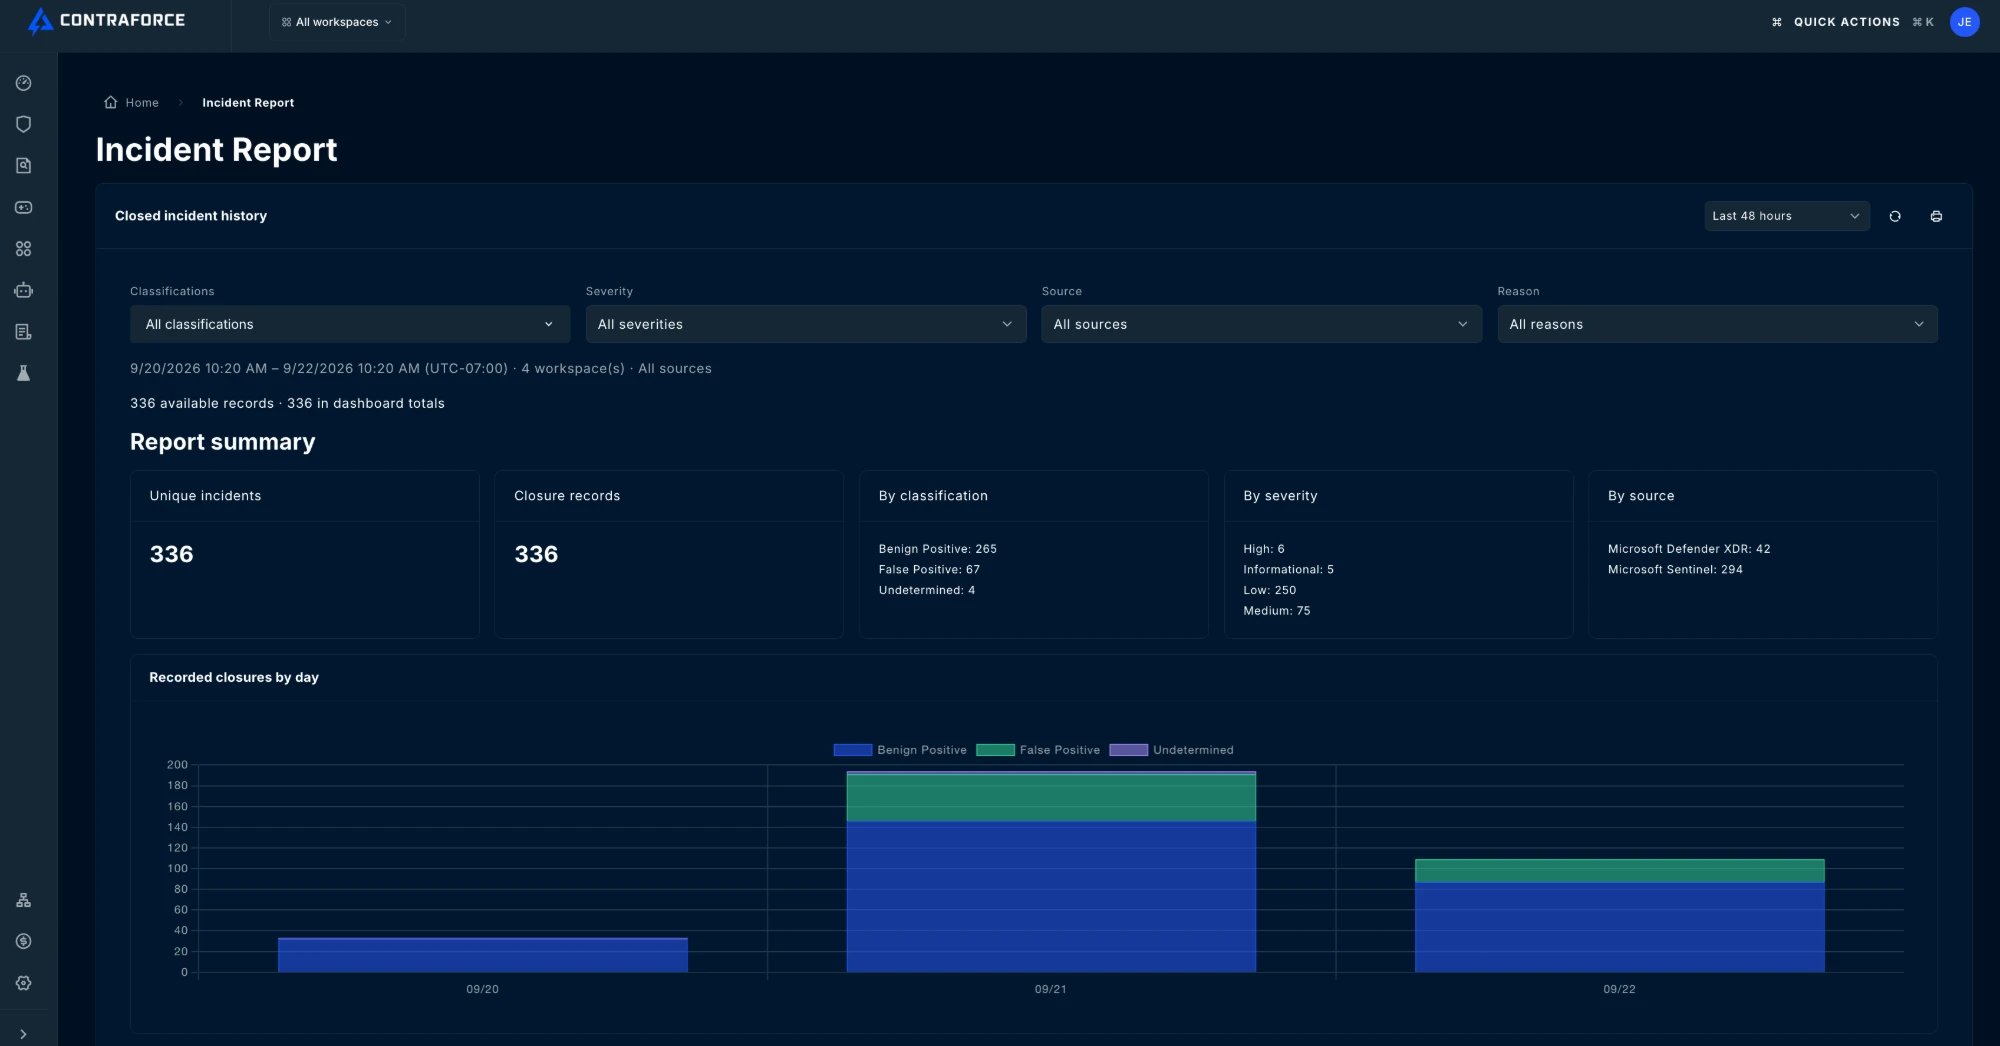
Opening the report from the Command Dashboard
Every entry point carries your current dashboard time filter and workspace selection into the report. You never have to re-apply them.From the Closed Incident Tracker
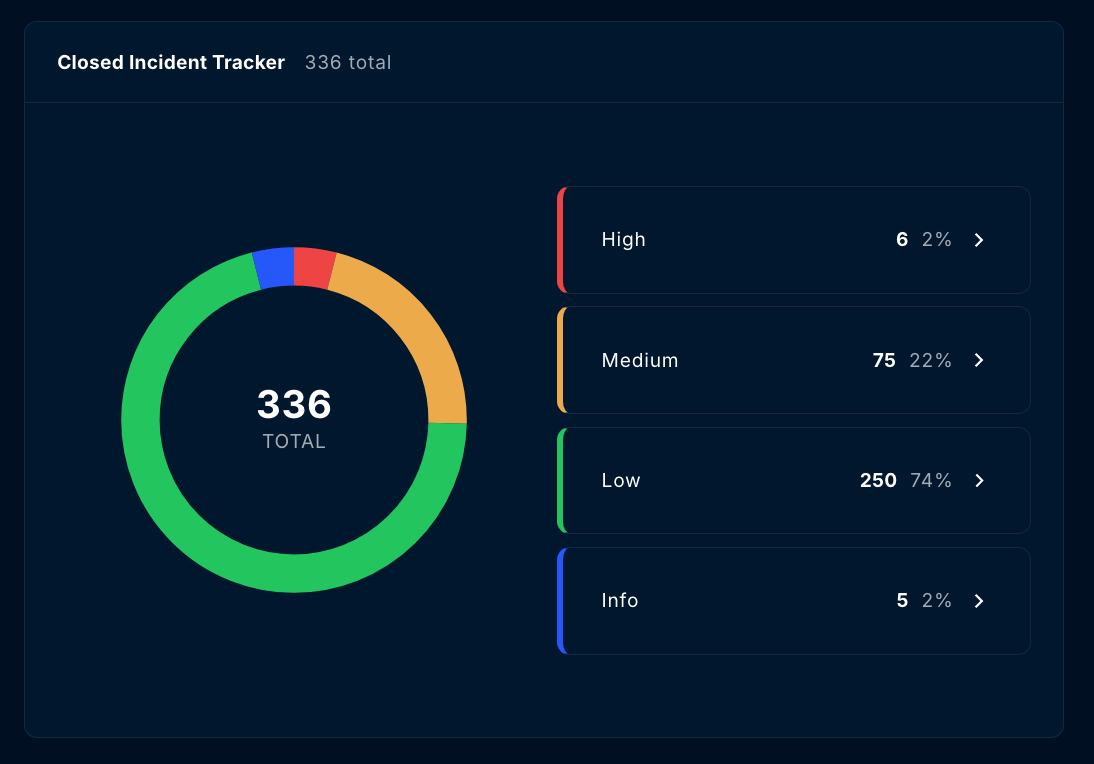
Each severity row shows the count, its share of the total, and an arrow indicating that the row is a link. Rows are not clickable while the dashboard is still loading.
The record count above the summary confirms what carried over, for example
336 available records · 336 in dashboard totals.
From Classification Trends
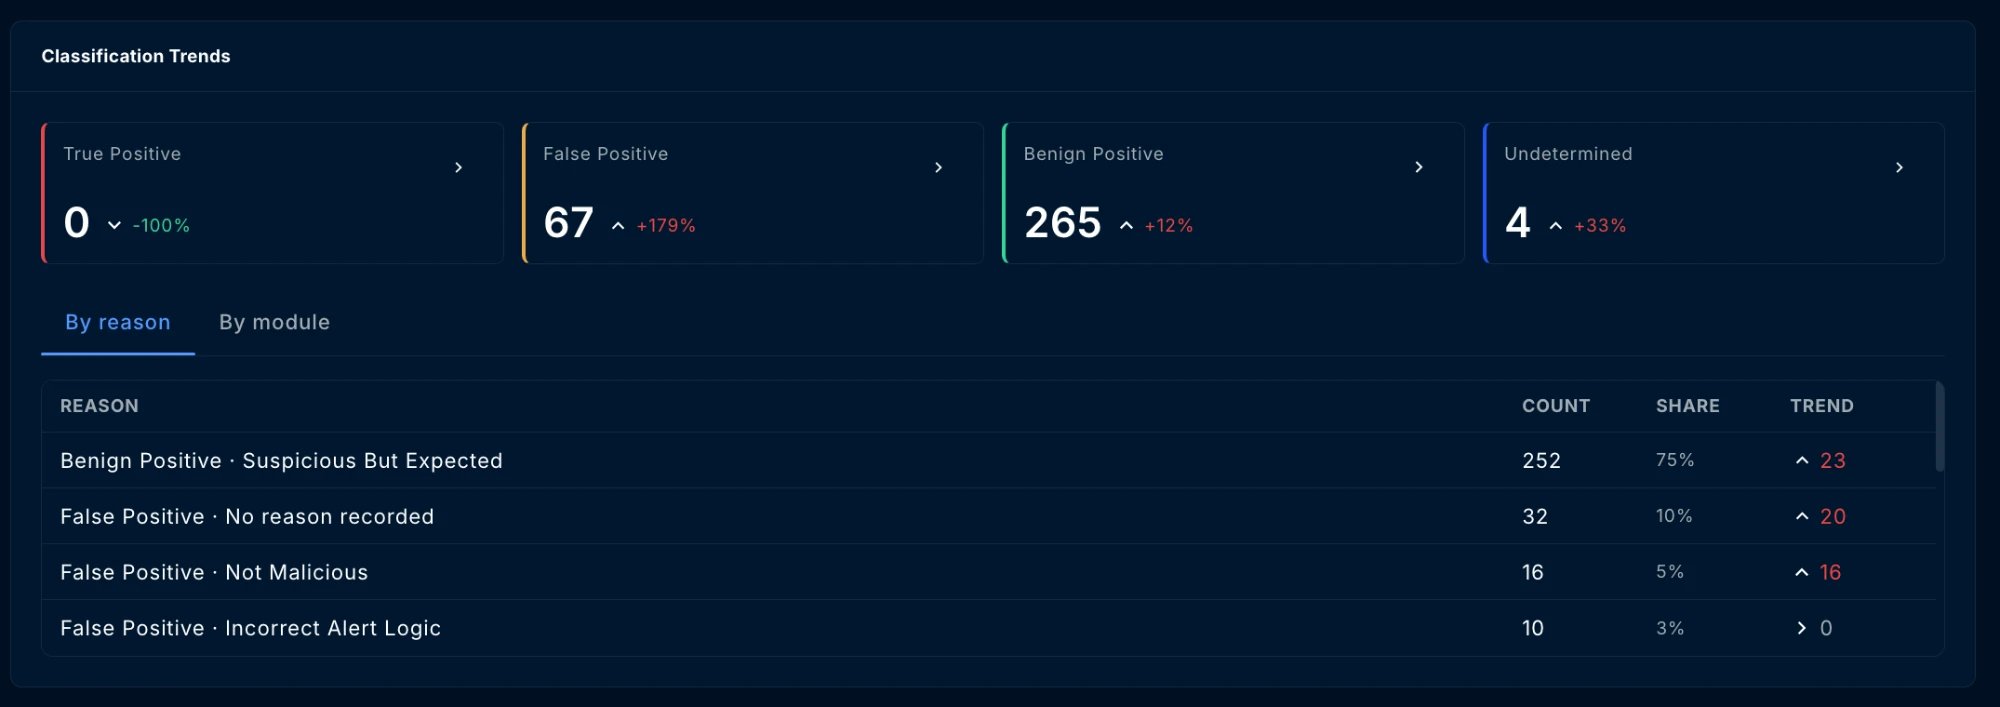
- Click the arrow on a classification card (True Positive, False Positive, Benign Positive, Undetermined) to open the report filtered to that classification.
- Inside the By reason and By module tabs, click a row to add that reason or source to the filter as well.
Reading the report
Header controls
Report filters
Below the header, four filters narrow the report further. Changing any of them reloads the report and updates the page address, so the filtered view can be bookmarked or shared.Classifications
Pick any combination of True Positive, Benign Positive, False Positive, and Undetermined, or choose All classifications.
Severity
High, Medium, Low, Informational, or Not retained for records where severity was not kept.
Source
Microsoft Sentinel, Microsoft Defender XDR, CrowdStrike, or SentinelOne.
Reason
The closure reason recorded by the analyst or agent, plus No reason recorded.
Report summary
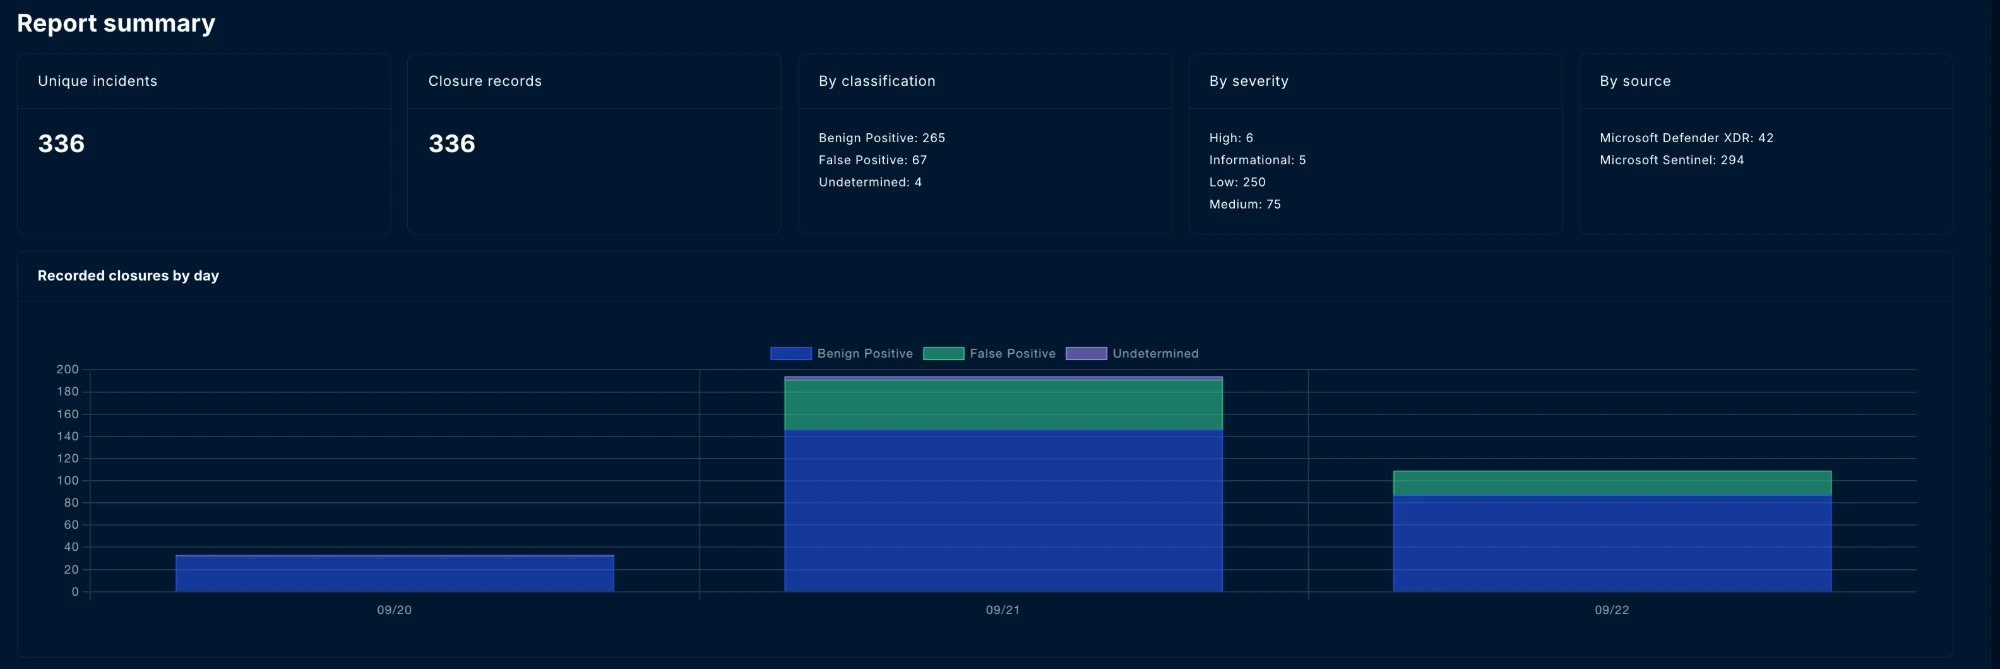
Below the cards, Recorded closures by day plots the same records as a stacked bar chart, one bar per UTC day, so you can see when activity clustered inside the period.
Workspace breakdown
A table repeats the same summary per workspace, so a provider managing many tenants can see which ones drove the totals without changing the workspace filter.Incident list
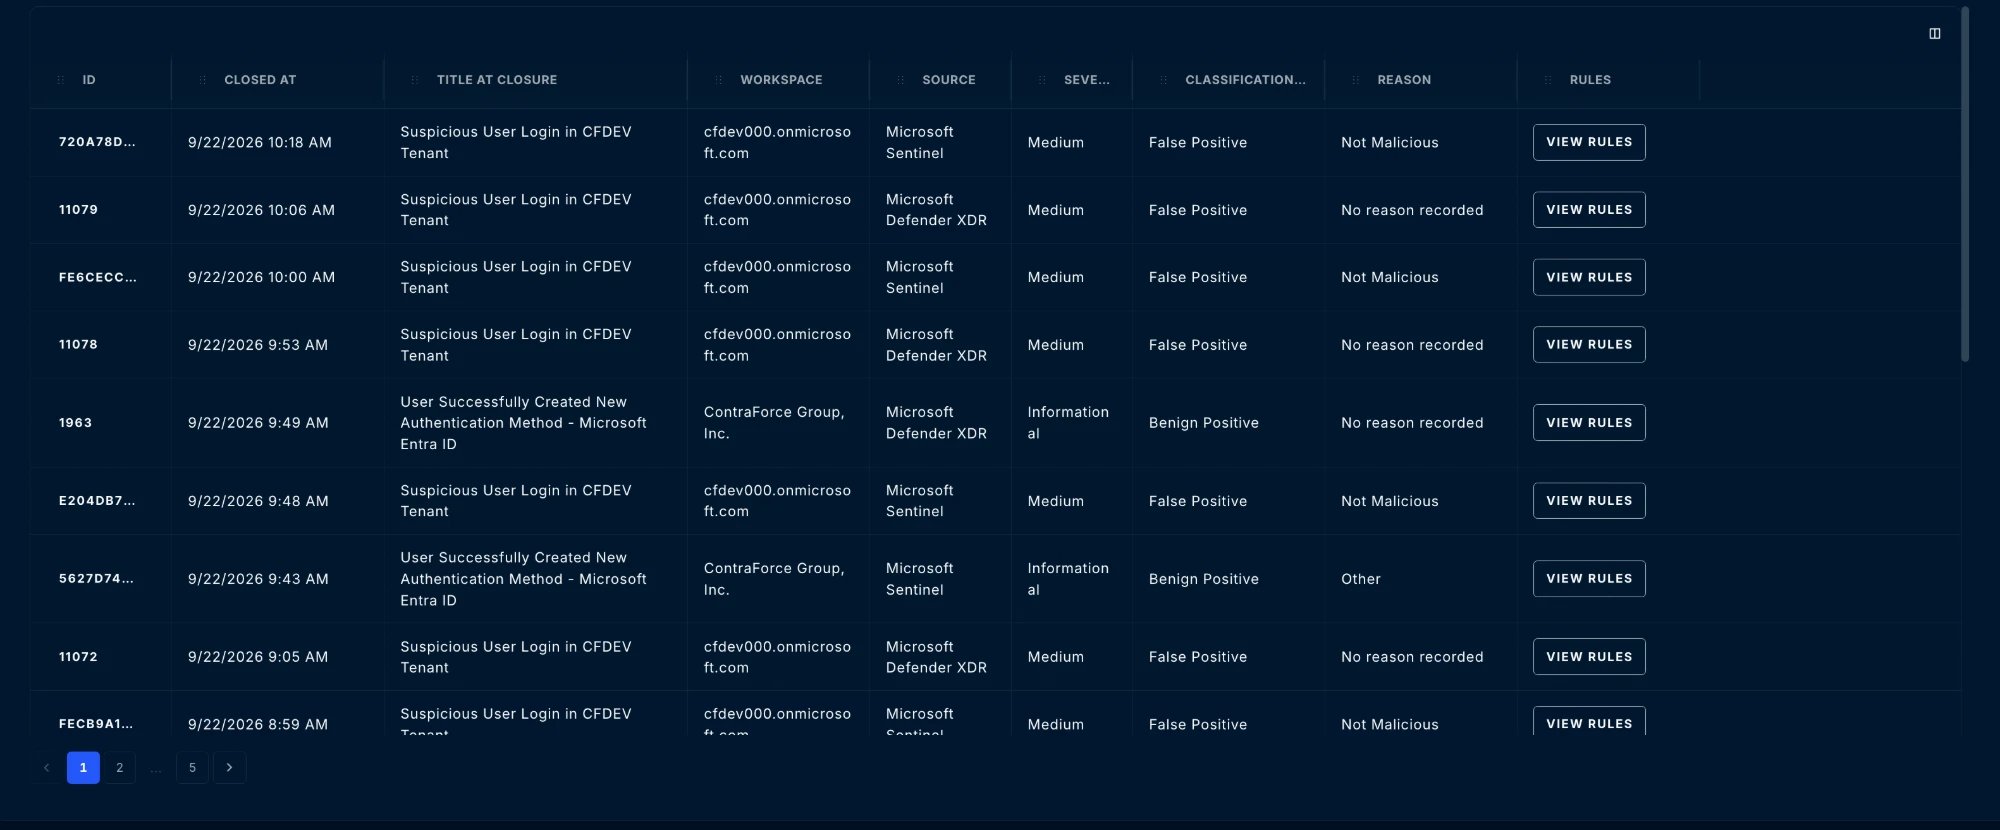
The list is paginated. Column layout persists between visits.
Rule navigation is available for Microsoft Sentinel and Microsoft Defender XDR incidents. CrowdStrike and SentinelOne incidents show a message instead.
Print or save as PDF
Select Print / Save as PDF in the report header to generate a clean, branded copy for a customer or a compliance file.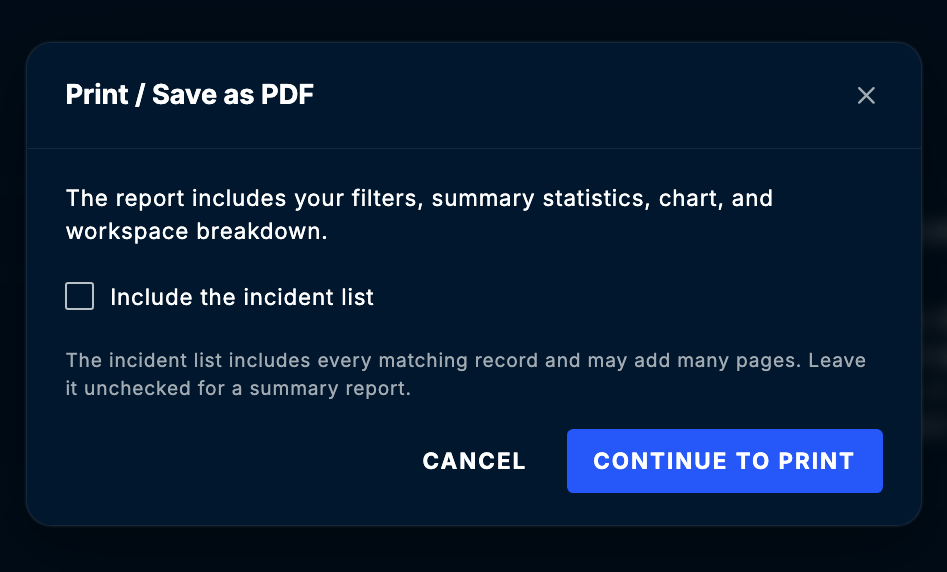
How the numbers are counted
Classification is recorded at closure
Classification is recorded at closure
The report shows the classification, severity, and title as they were when the incident was closed. Later edits in the source product are not reflected.
Incidents can appear on more than one day
Incidents can appear on more than one day
Each incident is counted once per UTC day. An incident closed, reopened, and closed again appears on each of those days in the chart, which is why closure records can exceed unique incidents.
Some closure details are not retained
Some closure details are not retained
Where the closure hour was kept but the exact minute was not, the time is marked
(approx.). Where severity was not kept, the record shows Not retained. Choose Not retained in the Severity filter to see those records, as specific severity filters exclude them.Coverage notices
Coverage notices
If the dashboard total is higher than the number of retained records, the report shows a notice explaining that only the available records are listed. The record count above the summary states both numbers.
Related guides
Command Dashboard
The dashboard the report is launched from.
Incident Classifications
What each classification means and when to use it.
Incident Management
The workflow for triaging, investigating, and closing incidents.
Workbench Overview
What opens when you click an incident ID in the report.
Need help? Contact the ContraForce Support team at support@contraforce.com.